Welcome to Admin Dashboard
After logging into the Enroute application, users are directed to the Main Dashboard, which provides a comprehensive summary of orders, operational performance, and team statistics. Below is a detailed breakdown of each section of the dashboard:
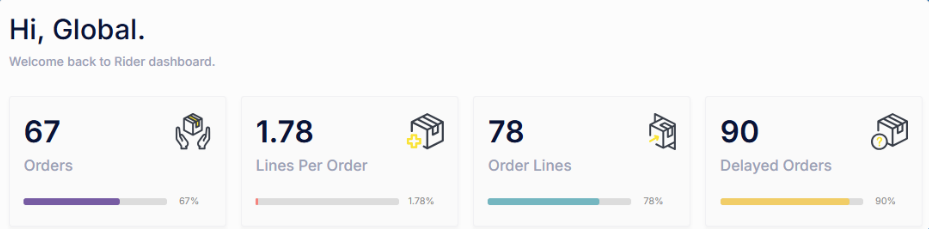
Summary Overview
This section gives a quick glance at the current operation metrics:
-
Orders
- 67 Orders have been placed.
- The progress bar indicates 67% completed toward the target or expected volume.
-
Lines Per Order
- On average, each order contains 1.78 lines, showing multiple items per order.
- The indicator shows 1.78% progress relative to the predefined benchmark.
-
Order Lines
- A total of 78 Order Lines have been recorded.
- 78% completion suggests the system is actively processing most orders.
-
Delayed Orders
- 90 Orders are currently delayed.
- The delay rate stands at 90%, which may require prompt attention.
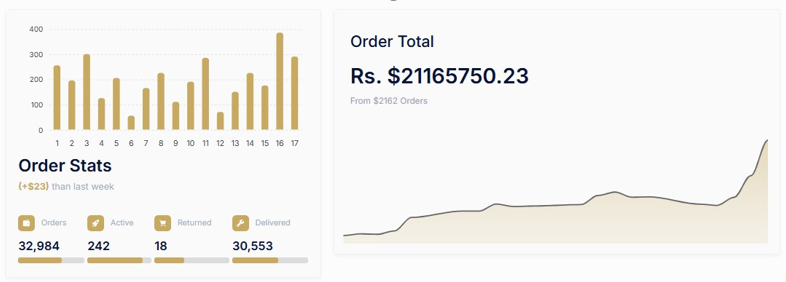
Order Statistics and Revenue
This section provides insight into order volume trends and overall revenue performance.
-
Order Stats (Bar Chart)
- Daily order volume is visualized for the last 17 days.
- Useful for identifying peak days, trends, and operational load.
-
Order Breakdown
- Total Orders: 32,984
- Active Orders: 242
- Returned Orders: 18
- Delivered Orders: 30,553
- The bar below each figure visually indicates the relative scale.
-
Order Total (Revenue Overview)
- Total earnings amount to Rs. 21,165,750.23, generated from 2,162 orders.
- A growth line graph shows revenue progression over time.
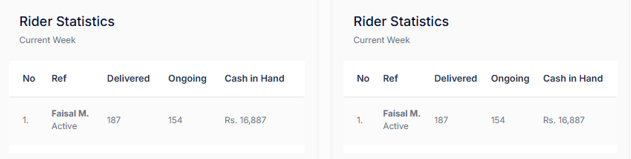
Rider Performance – Weekly Statistics
This section highlights the weekly performance of individual riders, offering visibility into their delivery activity and cash handling.
- Rider Name: Faisal M.
- Status: Active
- Delivered Orders: 187
- Ongoing Orders: 154
- Cash in Hand: Rs. 16,887